You might have worked in the healthcare field but have always been interested in how analyzing clinical data can help to improve patient outcomes, from finding ways to reduce patient re-admission rates to improving patient satisfaction rates. You might have worked in the IT field and wanted to work towards having an impact on the day-to-day lives of citizens. Or you might have straddled both areas where you have an interest in healthcare and how technology can help clinicians provide more effective care.
If this sounds like you, you might interested in the role of a healthcare data analyst!
(If you prefer to watch 🙂)
In this blog post, I want to provide some tips for those who are looking to transition to a healthcare analyst job in the health informatics field. As you might have experienced during your job search, many roles in the health informatics field are looking for those years of experience even though some might be listed as entry-level. So you get into this chicken and egg situation where you need experience to get the job, but the job requires experience…

Why Should You Build a Clinical Business Intelligence Portfolio Project?
Although, getting a job can be equal parts timing and luck, just throwing your resume into the void of LinkedIn or Indeed can feel like you’re not even moving the needle. Instead, you can consider developing your technical skills in Power BI and SQL by creating a portfolio project with a clinical lens, to help develop and showcase your technical skills, especially if you already have a strong clinical background as a nurse or pharmacy technician. Creating a portfolio project can show to hiring managers that you also have the necessary technical skills which can help strengthen your application when applying to jobs.
I want to highlight the importance of showcasing skills you have learned in the form of a project. In the past, on-the-job training was quite common and existing staff would help guide you to get acclimatized to the role, especially if you were entry-level. In the modern-day job market, there are so many entry-level applicants applying to roles that hiring managers have their pick of the litter.
With companies being understaffed and existing internal staff overworked, if there are opportunities to not have to spend money and time training junior staff, hiring managers will favour candidates who have prior experience through internships or placements, especially if they already have experience in a specific tool listed in the job description, such as SQL or Power BI.
I personally wish companies would go back to investing in their staff and training people and this is the case at some companies but more and more companies are raising the bar for entry-level individuals. Since we are at the mercy of the job market, I would consider if you are in school currently, prioritizing internships that can help you develop marketable skills and if you are not in school, I would suggest taking courses online and then developing a portfolio project to showcase to hiring managers.
“If you can’t measure it, you can’t improve it.” – Peter Drucker
Clinical business intelligence can be described as a suite of tools and programs with a focus on measuring clinical metrics (e.g. patient readmission rates, patient satisfaction scores etc…). Some of these tools might include analytical tools such as R, Excel, or Python or data visualization tools such as Power BI and Tableau. There are many tools that exist and if you have an analyst’s mindset you might want to dive directly into analyzing the data but I believe that the first step should be having conversations with frontline staff on what are the issues they see daily in their roles and how these business intelligence tools can help aid or reduce the burden on their tasks. The ideal goal would be to seamlessly integrate this tool into their existing workflow and not add additional burden.
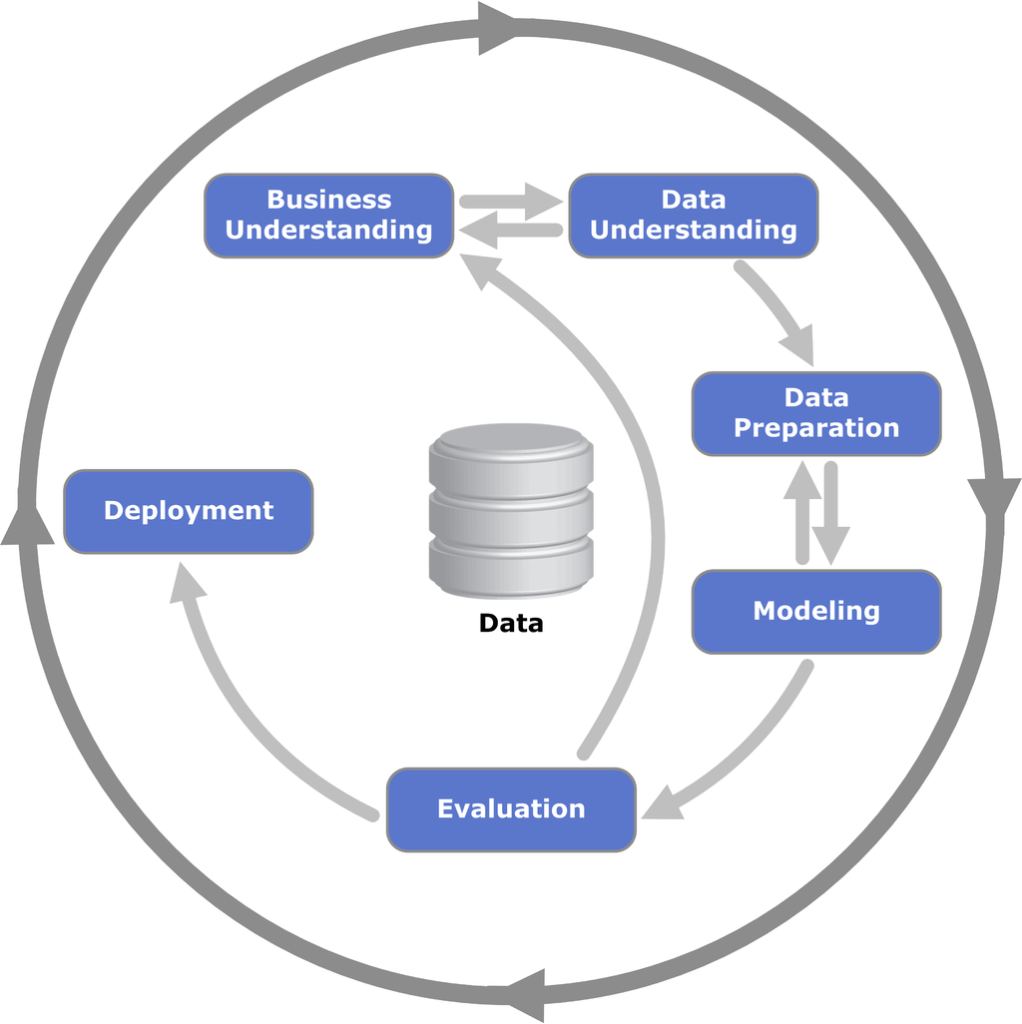
When I first think of how I will solve a data problem, I always refer to the below image of the CRISP-DM (Cross-Industry Standard Process for Data Mining) methodology popularized by IBM.
When it comes to understanding the business need for developing a clinical data product (e.g., clinical dashboard), you want to ask a wide range of individuals who will be interacting with this data product from clinicians, senior management to administrators.
Some example questions to ask end-users include:
1. How will this report/dashboard help you to do your job more effectively?
2. What are the top 3 benefits you want to see, as a result of this report/dashboard being implemented?
3. How involved do you want to be when it comes to interacting with the report/dashboard?
4. What processes do you already have in place to record your key performance indicators/clinical metrics?
5. What are the biggest pain points you have currently when collecting key performance indicators/clinical metrics?
Asking these questions or a variation of these questions can inform you what viewing permissions certain departments should have or which metrics would be beneficial to include on your data product based on the current clinical workflow.
Understanding how end-users will be using the tool on a day-to-day basis, how this tool will be integrated into their jobs, and what value it will provide to them is necessary information to understand, before designing your dashboard. This process might require multiple interviews and meetings initially but will save you time in the long run.
In addition, understanding why they need this tool built can help you to whittle down the scope of what you need to build. Depending on their answers, they might need a quick superficial overview of metrics that can be designed as a one-page report or they might be a more involved user group and will need real-time analysis of clinical metrics, therefore, a dashboard with multiple tabs might be a better option.
What are the benefits of clinical dashboards?
Clinical dashboards can be described as visualization tools to house healthcare data. They can include both quantitative and qualitative information and can be static or interactive. Clinical dashboards could report key metrics such as ER wait times, patient satisfaction & average length of hospital stay.
An effectively designed dashboard should be able to answer a user’s question without too much frustration from the end user or require external guidance by IT or Clinical Decision Support teams to navigate the dashboard. If this is a continued occurrence, users might become annoyed by the tool and stop using it entirely. Dashboards should support users in their day-to-day jobs and not become a hindrance, as it requires clinical buy-in if you are moving towards a data-driven health organization.
In Ontario, Markham Stouffville Hospital (MSH), found a significant reduction in the Emergency Department (ED) patient length-of-stay metrics with the help of dashboards. One caveat is that dashboards are not the sole driving force behind improvements in patient outcomes but can be part of the overall solution; if these dashboards are designed effectively and with the healthcare professional in mind.
This is an important consideration, you can’t just design a dashboard and expect people to use the dashboard automatically. You need buy-in from the clinicians using the dashboard, they need to have a say in the metrics that are used in the designing and planning stages of the dashboard. Also, there needs to be space for people to provide feedback and critique of the dashboard in the planning stages, as this will get people excited about using the dashboard as an integral part of their job.
What are common clinical metrics in the field?
As a healthcare data analyst, you might encounter these below clinical metrics:
Average Time to See Healthcare Provider: This can be the average elapsed time between when the patient was admitted and when they saw a healthcare provider.
Patient Satisfaction Scores: This can be a score provided by the patient rating the care provided with a score of 1 being very unsatisfied to 5 being very satisfied.
Patient Re-admission Rate: Was the patient re-admitted back to the hospital within a 30-day period?
Average Hospital Length of Stay: This can be the average elapsed time between when the patient was admitted and when they were discharged.
Each hospital or healthcare organization can determine what are the target values for these clinical metrics as this can vary widely based on the location and size of the organization to name a few factors. These metrics can be a holistic view of how the organization is performing and by focusing on these metrics, one can help drive improved patient outcomes.
Understanding historical performance is another good way to determine target values, however, there are some anomalies such as the COVID-19 pandemic which might drastically change metrics (e.g., staffing rates) that might have to be taken into consideration when looking at historical data. These metrics can represent a holistic view of how the organization is performing and by focusing on these metrics, one can help drive improved patient outcomes.
When building a dashboard, it is also important to include an information page that can speak to the metrics and provide context to the data. Where the data has been collected from and some of the limitations of displaying the data, for example, you might report on the population of missing data that was present in how many people you sampled to determine the Patient Satisfaction Scores from a hospital. You might also want to report on the inherent nature of shared accountability when it comes to clinical metrics and how care does not just stop within the hospital but also outside, concerning community care and social determinants of health.
If you want to do a deeper dive into these clinical metrics, I run a podcast called the Health Analytic Insights podcast, where I talk all about the field of health informatics and have done a Healthcare Analytic Metrics series here, dividing deeper into providing context about these clinical metrics.
What are the Key Technical Skills of a Healthcare Data Analyst?
If you look at enough job descriptions in this field, you will start to see patterns in key skills that are often advertised for healthcare analyst roles. These skills include some clinical experience, this could be working previously as a nurse, pharmacy technician, clinical research assistant, or at the help desk at a hospital, it could also be through a degree obtaining your master’s in health informatics.
You might also see these roles advertising for people who have experience with data visualization tools, this can be something as standard as experience building charts and graphs in Excel to experience with more advanced tools, such as Power BI and Tableau. If you are interested in learning data visualization, I would suggest downloading Power BI Desktop, which you can do for free, and searching for Power BI on Microsoft Learn which contains tons of free tutorials, where you can beef up your data visualization skills in this space.
One programming language that you might see advertised over and over again for health informatics roles is experience with SQL, which stands for Structured Query Language. This is a language that is used to interact with the data stored in databases. With the move to digitizing healthcare records, the amount of data that is stored and collected in healthcare organizations has exponentially grown. This is one of the reasons why a career in health informatics can be fulfilling as problems are always changing, never a dull moment! To be able to sort through all the different types of healthcare data that exist from healthcare claims, bloodwork data from the labs, and patient demographic information, SQL is used to sort through tables and organize messy data into actionable information.
Finally, strong communication skills are key in most roles but are especially important in the health informatics field. Often time you will be the “Analytical translator” This is a term that was coined from a McKinsey article that describes the healthcare analyst role beautifully. You might be meeting with clinicians who would like a dashboard or report built that helps them to better track certain clinical metrics. Then you might have to meet with the developer or IT to communicate the insights of the clinicians and work with them to build a solution.
What are Common Job Titles to Search For in this Field?
Oftentimes I will get this question from listeners of the podcast, what jobs should I be searching for in this field, I don’t even know where to start! This makes a lot of sense because this field is relatively new and doesn’t tend to have established titles such as project manager or business analyst. Therefore, I advise people to search for a technical tool they might have expertise in + the word “healthcare”. For example, one could enter “Power BI + healthcare” into the search box of Indeed or LinkedIn.
In addition, once you start searching enough you will start to see most job titles in this field tend to have the title “Analyst” in them so for example: Clinical Systems Analyst, EHR Analyst, Information System, Analyst Clinical Decision Support Analyst, and Application Analyst might be some job titles that may exist where you live.
Another tip if you currently work in a clinical or healthcare organization you might want to see if your organization has a Business Intelligence or Clinical Decision Support department and analyze the roles within this department. See if there is an opportunity for you to job shadow for some of these roles so you can either identify any technical skill gaps you might have or even see if the work is of interest to you and if you would like to pivot into an informatics role. Also, check out the AHMIA Career Map here which can provide you with additional job titles to look up.
In this blog post, I emphasized the importance of creating your own portfolio projects and learning skills such as Power BI and SQL. One of the major hurdles to creating a clinical portfolio project is the lack of open-source clinical datasets which exist because of the risks of releasing personal health information publicly. Therefore, you can find tons of data analytical courses using the popular Microsoft AdventureWorks dataset but it is much harder to find an analytical course with a clinical lens.
This is something that I struggled with when I first pivoted into this field and I have created an online course with a clinically focused dataset (which uses fake dummy data) which you can use to create your own portfolio project. I also walk you through in detail, how to write common SQL queries and we walk through step-by-step how you can build your own Hospital KPI Dashboard (using the clinical metrics discussed in this post). As a result of completing this course, you can showcase this dashboard with a unique link that can be embedded in a professional blog or hyperlinked in your resume, for hiring managers to see the initiative you took to get that first role. Completing this course will provide you an opportunity to speak to the specific data cleansing methods you applied and the overall technical skills you have developed. Click the button below, to move towards getting your first role as a healthcare data analyst!

0 Comments