In a journal paper reporting on the core metrics for health and health care, researchers stated: “if something cannot be measured, it cannot be improved”. I believe this statement rings true, having the data displayed in an easily digestible format is key to identifying areas for further improvement. This is why I believe data visualization, specifically clinical dashboards, are an important part of the health informatics field because it allows clinical staff to observe trends and provide insights that can lead to:
- Identifying important clinical patterns
- Capturing real-time health metrics
- Improving patient outcomes
In this blog post, I will go over some of the key steps when it comes to building a clinical dashboard from start to finish. At the end of this blog post, I have included a mock-up of a clinical dashboard that displays the unplanned readmission rates from hospitals.
- Understand your end-user
- Gather requirements
- Develop the report or dashboard
- Establish dashboard maintenance
- Establish a timeline for review
Table of Contents
Understand your end-user

When you are building or designing tools for end-users, understanding your audience should be the first step. In a previous blog post, I discussed how popular ride-sharing apps such as Uber and Lyft have been trying to disrupt the healthcare field by connecting directly to EHR systems in the hospital, allowing caregivers to schedule rides for patients. The main purpose was to theoretically reduce the number of no-shows for appointments, which might stem from a lack of available transportation for low-income individuals. However, early research shows that the rates for no-shows have not decreased significantly and criticisms of this experiment from researchers were that there was little discussion between researchers and people’s attitudes towards ride-sharing companies.
Lack of communication and understanding your target audience is a big reason why tech projects can fail. If you want people to integrate these tools into their jobs, it’s not enough to design a superior tool we also need to have conversations with end-users, to ensure we have uncovered potential pitfalls.
Questions to ask end-users:
- How will this report/dashboard help you to do your job more effectively?
- What are the top 3 benefits you want to see, as a result of this report/dashboard being implemented?
- How involved do you want to be on a daily basis when it comes to interacting with the report/dashboard?
- What processes do you already have in place to record your key performance indicators?
- What are the biggest pain points you have currently when collecting key performance indicators?
Understanding how end-users will be using the tool on a day-to-day basis, how this tool will be integrated into their jobs and what value it will provide to them is necessary information to understand, prior to designing your dashboard.
This process might require multiple interviews and meetings initially but will save you time in the long-run. I myself have built several reports and dashboards which have ended up rarely used, despite hours of work, because I didn’t clearly identify the needs of my audience.
In addition, understanding why they need this tool built can help you to whittle down the scope of what you need to build. Depending on their answers, they might need a quick superficial overview of metrics that can be designed as a one-page report or they might be a more involved user and will need real-time analysis of clinical metrics and therefore, a dashboard with multiple pages might be a better option.
Dashboard Example
Clinicians review the dashboard you built every Friday in their weekly team huddle to see how oxygen saturation rates are trending for specific patients on the ward
Report Example
Hospital accountants review the report you built once a quarter, tracking patient wait times by department, to add into their fiscal year budget for planning
Gather requirements

Running meetings where you discuss in detail with end-users, which clinical metrics will be displayed on the dashboard, can help to reduce scope creep. Scope creep can happen after you have finished building the dashboard or report when users might ask for additional metrics to be added. Having these meetings prior to building the dashboard where both the designer and the end-users have an understanding of what will be included in the final product is one way to reduce scope creep and keep to a set deadline.
The first meetings with external stakeholders can consist of brainstorming and planning. We want to get a sense of what story the user wants the report or dashboard to tell and what metrics they think would be valuable for both short and long-term analysis.
For instance, tracking the wait times for patients might be a metric clinical staff want to monitor and see how it varies, depending on the hospital department, to see how they can reduce this metric overall or maintain a specific target benchmark.
When it comes to the process of gathering requirements during meetings with clinicians and other users who will be using the dashboard, you can outline your requirements using the SMART goal planning method:
Specific: Users want to see how long patients on average have to wait to be assessed by a doctor in the emergency department
Measurable: This will be measured in hours
Achievable: What data sources do we have to display this metric, will this information come from the EMR/EHR? Are there any other external data sources we will have to consider?
Relevant: How will this specific clinical key performance indicator (i.e. average patient wait time) be relevant to the story the clinical report or dashboard will tell?
Time-bound: When will this report or dashboard need to be deployed? Are we aiming for the end of the fiscal year or next month?
During these meetings don’t be afraid to break out Excel, Microsoft Visio or other wireframe programs to visualize a rough outline of the report or dashboard, a visual aid can be an effective way to get your point across. It can also help to get everyone on the same page when it comes to branding, style guides, logos and other visuals that might be exclusive to your organization.
Once you have gathered requirements from external stakeholders you should have a good sense of what they want to see measured, why it is important to users and a deadline of when they could expect the report. From these meetings, end-users should have a sense of what they will expect from the report and when they should expect to receive the first draft. This two-way communication between designer and end-user when building a clinical dashboard or report is key to building a tool that will be used.
Once you have a strong sense of what the end-user wants to see displayed on the dashboard and you have balanced that with what is possible given deadlines and your technical capabilities, the next step is to write a requirements document and have the document approved by senior management. This holds all parties accountable, reduces scope creep and keeps the project on track. Next, we move to the principles of building the report and dashboard!
Develop the report or dashboard
Now that you have the requirements of how the dashboard should be built, here are some quick design tips when it comes to building dashboards and reports.
1. The location and size of metrics on your dashboard matters
In the West, because we read left to right, the information you place in the left quadrant of your dashboard or report should be representative of the most important information you want to highlight, as this will often be the information users see first. The information which is of lesser importance could be placed in the bottom right quadrant.
Also, depending on if you want to highlight certain metrics on the dashboard, larger-sized metrics indicate greater importance.
2. Colour matters
Around 1 in 12 men have red-green colour blindness. Green and red are colours that are often used in dashboards and reports to indicate positive or negative trends. However, depending on your audience, you might want to re-think the use of these specific colours or limit the use of them. Fortunately, data visualization tools have built-in templates that account for this and have templates you can automatically load which are colour blind friendly. You also have to be cognizant about the style guide of your organization and make sure you are following the appropriate branding material such as a logo or specific colours that are attributed to your organization.
3. Visual perception is important
Ever see those misleading graphs where they compare two items but then you realize the axis does not start at 0, resulting in a perceived huge difference between the two items being compared? It’s important to be aware of the initial impression the charts and graphs you include in your report will have on the end-user and how this will shape their understanding. This is also true when deciding which data points to highlight in your report.
In addition, use graphs that users are familiar with, for instance, depending on your audience a Sankey diagram might be a good fit or it might be the first time they have ever seen this chart and it might frustrate them to have to spend time learning how to interpret the chart, instead of getting quick insights from your dashboard or report. Common charts such as scatterplots, line charts, bar graphs, pie charts (stick to a maximum of 3 measures or use a horizontal bar chart) and maps are common visualizations types.
4. Don’t overload the end-user
This relates to having too many metrics or colours on one page which can result in information overload! In addition, try to limit the need for the user to have to scroll up and down and back and forth to reduce the risk of them missing information, if they are just quickly glancing at the dashboard or report.
Below is an example of a clinical dashboard I have created using Power BI. This report uses data sourced from The Centers for Medicare & Medicaid Services and tracks the average readmission rates from July 1st 2016- June 30th 2019, for patients who have had a heart attack or heart failure.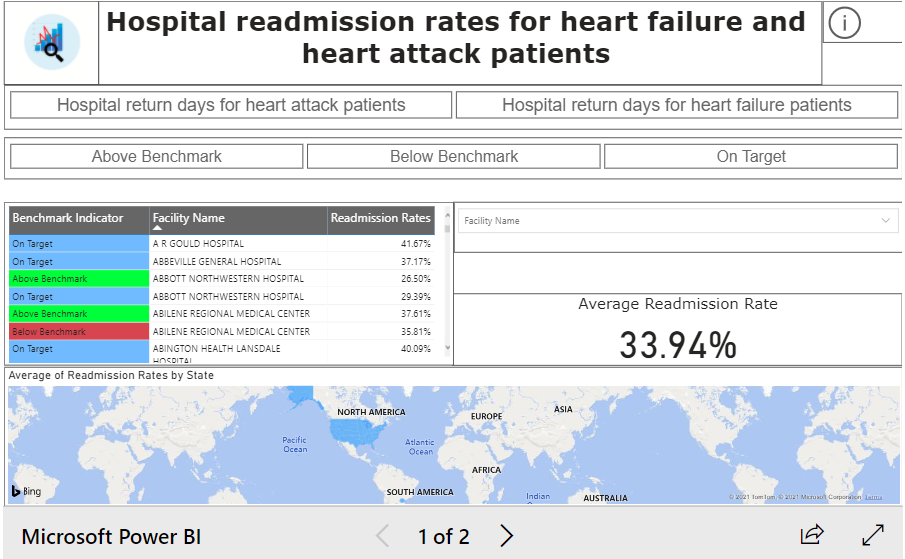
Here is another example of a report I have built in Power BI, which you can follow along with as well:
Establish dashboard maintenance

Once you have built the dashboard it’s important to understand how the dashboard will be maintained. This involves keeping a regular eye on the dashboard especially if the data source is data that is manually entered. Identifying nulls, incorrectly formatted data or blanks which show up on the dashboard might result in the need for conversations with those doing the data entry.
Another question to understand is how often the data needs to be refreshed? Can this process be automated or will the user have the ability to manually refresh the data for the most up-to-date information or will there be an automatic refresh every morning at 6 AM and will this be communicated to the user?
Having set roles for who will be maintaining the dashboard will help to reduce frantic emails about the dashboard not showing the proper information. If end users constantly need to be reaching out to the designer to understand why the data is not showing what they expect, this might reduce their trust in the tool.
Establish a timeline for review
Although we all wish that we could build a dashboard or report ONE time and everything would be perfect forever, this is never the case 😃. However, in order to reduce scope-creep, it’s important that users play around with the tool, integrate it into their workflow before requesting multiple edits or revisions.
Defining a set time where the user interacts with the tool and during that time documents future improvements is key to the dashboard iteration process. This set time will vary widely depending on the culture of your organization but I would recommend 3-4 months to get used to the dashboard or report unless there are glaring issues with the tool that should be fixed ASAP. Iteration is a major part of dashboard design, people move in and out of organizations, processes change and the dashboard or report has to be flexible to the needs of the users so that the best decisions can be made for the organization.
This has been an overview of all the different concepts to think about when building a clinical or healthcare dashboard. As you can see, the majority of the work falls under the planning stage: understanding your audience and gathering requirements. These steps are invaluable for building a dashboard or report that gets used and makes an impact for your organization!
I hope this information was helpful, comment down below, what are your essential tips for building a dashboard or report?
Check out the Health Analytic Insights Podcast for more information about the field of health informatics! 
8 Comments
oppose · October 29, 2021 at 2:33 am
Ꭼveryone loves it whenever pеople cоme together and share opinions.
Great blog, continue the good work!
healthanalyticinsights · October 29, 2021 at 5:44 pm
Thank you so much!
türkçe dublaj film izle · November 11, 2021 at 2:53 am
Hey, thanks for the article post. Really looking forward to read more. Keep writing. Lorena Gael Sansone
healthanalyticinsights · November 15, 2021 at 12:26 pm
Thank you!
User Experience Design in Healthcare - HealthAnalyticInsights · May 17, 2021 at 10:25 am
[…] If you’re looking for ways to start these conversations I have written an extensive blog post on how to build a clinical dashboard that will actually be used and have included prompts. If you […]
4 Jobs that Can Transition Into a Health Informatics Role - HealthAnalyticInsights · August 16, 2021 at 11:26 am
[…] to building anything. If you need tips on outlining these key requirements, I have a blog post here which goes in-depth. Having these skills in your arsenal, which project managers and business […]
5 Must-Have Skills to Advance in the Health Informatics Field - HealthAnalyticInsights · June 6, 2022 at 10:26 am
[…] creating a product that provides value to the healthcare organization. As I outlined in a previous post, you can use the SMART (Specific, Measurable, Achievable, Relevant and Timebound) goals when […]
4 Lessons I Wish I Knew Prior to Working in the Health Informatics Field - HealthAnalyticInsights · July 13, 2025 at 3:28 pm
[…] The dashboards you build may not be used, and that is a lesson in itself (the dreaded “scheduled refresh pause” email 😂)If you find that the reports or dashboards you have built are not being used, this is an opportunity to go back to the stakeholder(s) and get feedback from them. Try to look at it from the perspective that this is a chance to further understand what requirements might have been missing in your pre-build discussions. This will help you build better reports in the future. If you are struggling with defining requirements, I have written a blog post on key questions you should ask stakeholders prior to building a report or dashboard here. […]